The Observability Layer
Posted on Sun 22 March 2026 in Python

Seams series
The Problem Story
Your agent is in production. Users occasionally report slow responses - sometimes five seconds, sometimes thirty. You check the logs: the request completed. The agent returned an answer. Nothing failed.
You have no idea which part was slow.
Was the LLM call slow? Did the tool make a network request that timed out and retried? Did the prompt retrieval take unusually long? You can't tell, because you're looking at a single line per request: POST /api/chat 200 12.3s. The twelve seconds is a fact. Its cause is invisible.
A week later, your finance team asks how many tokens you're burning per day and which models you're using. You look at the codebase. The token counts are... nowhere persistent. They go into the LLM response object and then disappear. You explain to finance that you'll have an answer next week.
Both problems have the same root: the app treats observability as an afterthought rather than a seam. Requests go in, answers come out, and the interior is dark.
The Principle: Two Kinds of Observability
Before the code: these are not the same thing.
Tracing answers what happened inside this request. It's a timeline of events - the LLM call started at T+0, finished at T+2.3s, consumed 400 tokens; the weather tool started at T+2.4s, finished at T+3.1s. One trace per request. You reach for it when debugging a specific slow conversation.
Metrics answer how is the system behaving over time. Requests per minute, p95 latency, token consumption rate, tool call frequency. Aggregated across all requests. You reach for it when watching a dashboard at 3pm on a Tuesday and wondering whether the new model is cheaper.
Seam 5 does both - and keeps them separately swappable.
The Code
The tracing handler
OtelCallbackHandler is a LangChain callback that wires into every LLM call and tool invocation in the request. It's instantiated fresh per request and discarded when the request ends.
# app/observability/tracing.py
class OtelCallbackHandler(BaseCallbackHandler):
    def __init__(self, tracer, trace_id: str):
        self.tracer = tracer
        self.trace_id = trace_id
        self.spans: list[dict] = []
        self.token_usage: dict = {"prompt_tokens": 0, "completion_tokens": 0, "total_tokens": 0}
        self.tool_calls: list[dict] = []
        self._llm_starts: dict = {}
        self._tool_starts: dict = {}
The _llm_starts and _tool_starts dicts are keyed by run_id - LangChain's mechanism for correlating a start callback with its matching end callback. When on_llm_start fires, it stores the start time under the run_id. When on_llm_end fires with the same run_id, the handler computes the latency and emits a span.
def on_llm_start(self, serialized, prompts, *, run_id, **kwargs):
    self._llm_starts[str(run_id)] = time.monotonic()

def on_llm_end(self, response: LLMResult, *, run_id, **kwargs):
    start = self._llm_starts.pop(str(run_id), None)
    latency_ms = (time.monotonic() - start) * 1000 if start else 0

    # Token handling - supports both old and new LangChain formats
    usage = {}
    if response.llm_output:
        usage = response.llm_output.get("token_usage", {})
    elif response.generations and response.generations[0]:
        gen = response.generations[0][0]
        if hasattr(gen, "message") and hasattr(gen.message, "usage_metadata"):
            meta = gen.message.usage_metadata
            usage = {
                "prompt_tokens": meta.get("input_tokens", 0),
                "completion_tokens": meta.get("output_tokens", 0),
                "total_tokens": meta.get("total_tokens", 0),
            }

    for key in ("prompt_tokens", "completion_tokens", "total_tokens"):
        self.token_usage[key] += usage.get(key, 0)
The dual-format token handling is worth explaining. LangChain changed how token usage is reported when the underlying model APIs changed. The old path reads response.llm_output["token_usage"]; the new path reads gen.message.usage_metadata. Supporting both means the handler doesn't break when you upgrade LangChain or swap providers.
Tool spans follow the same start/end pattern:
def on_tool_start(self, serialized, input_str, *, run_id, **kwargs):
    self._tool_starts[str(run_id)] = {"start": time.monotonic(), "input": input_str,
                                       "name": serialized.get("name", "unknown")}

def on_tool_end(self, output, *, run_id, **kwargs):
    record = self._tool_starts.pop(str(run_id), {})
    latency_ms = (time.monotonic() - record["start"]) * 1000 if record else 0
    self.tool_calls.append({"name": record.get("name"), "input": record.get("input"),
                             "output": str(output), "latency_ms": round(latency_ms, 2)})
Wiring the handler per request
The handler is injected once in the runner, before the agent call:
# app/agent/runner.py
tracer = request.app.state.tracer
otel_handler = OtelCallbackHandler(tracer, trace_id)

with tracer.start_as_current_span("agent.run") as span:
    span.set_attribute("llm.provider", settings.llm_provider)
    span.set_attribute("llm.model", settings.llm_model)
    span.set_attribute("prompt.key", prompt_key)
    span.set_attribute("prompt.version", str(prompt_version))

    result = await agent.ainvoke(
        {"messages": [HumanMessage(content=message)]},
        config=RunnableConfig(callbacks=[otel_handler]),
    )
RunnableConfig(callbacks=[otel_handler]) is LangChain's injection point. The handler receives every callback fired during the agent run - LLM calls, tool invocations, chain events - without the runner needing to know which callbacks will fire.
When the agent returns, the handler has accumulated all span data and token totals. The runner reads them and persists everything to ObservationLog:
log = ObservationLog(
    trace_id=trace_id,
    user_message=message,
    agent_response=answer,
    model=settings.llm_model,
    provider=settings.llm_provider,
    prompt_tokens=otel_handler.token_usage["prompt_tokens"],
    completion_tokens=otel_handler.token_usage["completion_tokens"],
    total_tokens=otel_handler.token_usage["total_tokens"],
    latency_ms=total_latency_ms,
    tool_calls=otel_handler.tool_calls,
)
The logs in the output can be seen
{
    "name": "tool.weather",
    "context": {
        "trace_id": "0x032a03a1a75c24fbd4cbf4df592b1f5a",
        "span_id": "0x33d8e995fa82d423",
        "trace_state": "[]"
    },
    "kind": "SpanKind.INTERNAL",
    "parent_id": "0xb56bd8f4c7391b3c",
    "start_time": "2026-03-22T20:17:01.137264Z",
    "end_time": "2026-03-22T20:17:01.137327Z",
    "status": {
        "status_code": "UNSET"
    },
    "attributes": {
        "tool.name": "weather",
        "tool.input": "{'location': 'Prestatyn'}",
        "tool.output": "content='Prestatyn, GB: 8.8\u00b0C, overcast clouds' name='weather' tool_call_id='call_t0MBLxQZMynSiDmtH1U1Q2mo'",
        "latency_ms": 440.95
    },
    "events": [],
    "links": [],
    "resource": {
        "attributes": {
            "telemetry.sdk.language": "python",
            "telemetry.sdk.name": "opentelemetry",
            "telemetry.sdk.version": "1.39.1",
            "service.name": "unknown_service"
        },
        "schema_url": ""
    }
}
The frontend trace panel gets the full span list in the API response - every LLM call and tool invocation with its latency, so a slow conversation can be diagnosed from the UI without touching logs.
The metrics layer
Prometheus metrics live in a separate file from the tracing handler - app/observability/metrics.py. Four metrics cover the main observability questions:
See here for the available metric types.
# app/observability/metrics.py
chat_requests_total = Counter(
    "chat_requests_total",
    "Total chat requests",
    ["provider", "model"],
)

chat_request_duration_seconds = Histogram(
    "chat_request_duration_seconds",
    "End-to-end request latency",
    ["provider", "model"],
    buckets=[0.5, 1.0, 2.0, 5.0, 10.0, 30.0, 60.0],
)

llm_tokens_total = Counter(
    "llm_tokens_total",
    "Token consumption",
    ["token_type", "provider", "model"],
)

tool_calls_total = Counter(
    "tool_calls_total",
    "Tool invocations",
    ["tool_name"],
)
Labels on every metric carry the provider and model name. This means Prometheus queries can break down costs and latency by model - useful when you're running A/B tests or comparing GPT-5.4 against a cheaper model.
The runner calls record_agent_metrics() after every request:
# app/observability/metrics.py
def record_agent_metrics(provider, model, latency_ms, token_usage, tool_calls):
    chat_requests_total.labels(provider=provider, model=model).inc()
    chat_request_duration_seconds.labels(provider=provider, model=model).observe(
        latency_ms / 1000
    )
    for token_type in ("prompt_tokens", "completion_tokens", "total_tokens"):
        llm_tokens_total.labels(
            token_type=token_type, provider=provider, model=model
        ).inc(token_usage.get(token_type, 0))
    for call in tool_calls:
        tool_calls_total.labels(tool_name=call["name"]).inc()
Exposing metrics
FastAPI exposes the Prometheus registry at GET /metrics:
# app/main.py
from prometheus_client import generate_latest, CONTENT_TYPE_LATEST

@app.get("/metrics")
def metrics():
    return Response(generate_latest(), media_type=CONTENT_TYPE_LATEST)
That's the entire integration. prometheus_client maintains the metric state globally; generate_latest() serialises the current values in Prometheus exposition format. No state to manage, no background thread.

The exporter - the swappable part
The tracing exporter is configured in one function:
# app/observability/tracing.py
def setup_tracing():
    provider = TracerProvider()
    provider.add_span_processor(
        SimpleSpanProcessor(ConsoleSpanExporter())
    )
    trace.set_tracer_provider(provider)
    return trace.get_tracer("change_seams.agent")
Right now it writes spans to stdout - useful for development, where you can docker-compose logs backend and see the raw span data. Switching to a real OTEL backend is a single function swap:
from opentelemetry.exporter.otlp.proto.grpc.trace_exporter import OTLPSpanExporter
from opentelemetry.sdk.trace.export import BatchSpanProcessor

def setup_tracing():
    provider = TracerProvider()
    provider.add_span_processor(
        BatchSpanProcessor(OTLPSpanExporter(endpoint="http://otel-collector:4317"))
    )
    trace.set_tracer_provider(provider)
    return trace.get_tracer("change_seams.agent")
Nothing else in the codebase changes. The handler continues emitting spans; only their destination changes.
Prometheus and Grafana

The full monitoring stack runs in docker-compose alongside the app. (I've commented out the app container to make it easier to play with the code in the app)
Prometheus scrapes the /metrics endpoint every 15 seconds:
# infra/prometheus.yml
global:
  scrape_interval: 15s

scrape_configs:
  - job_name: 'change_seams'
    static_configs:
      - targets: ['host.docker.internal:8000']
    metrics_path: /metrics
host.docker.internal lets the Prometheus container reach the backend running on the host. If you're running the backend inside Docker too, swap this for the service name.
Grafana provisions itself automatically on startup - no manual datasource configuration needed. The provisioning file at infra/grafana/provisioning/datasources/prometheus.yml points Grafana at Prometheus:
apiVersion: 1
datasources:
  - name: Prometheus
    type: prometheus
    access: proxy
    url: http://prometheus:9090
    isDefault: true
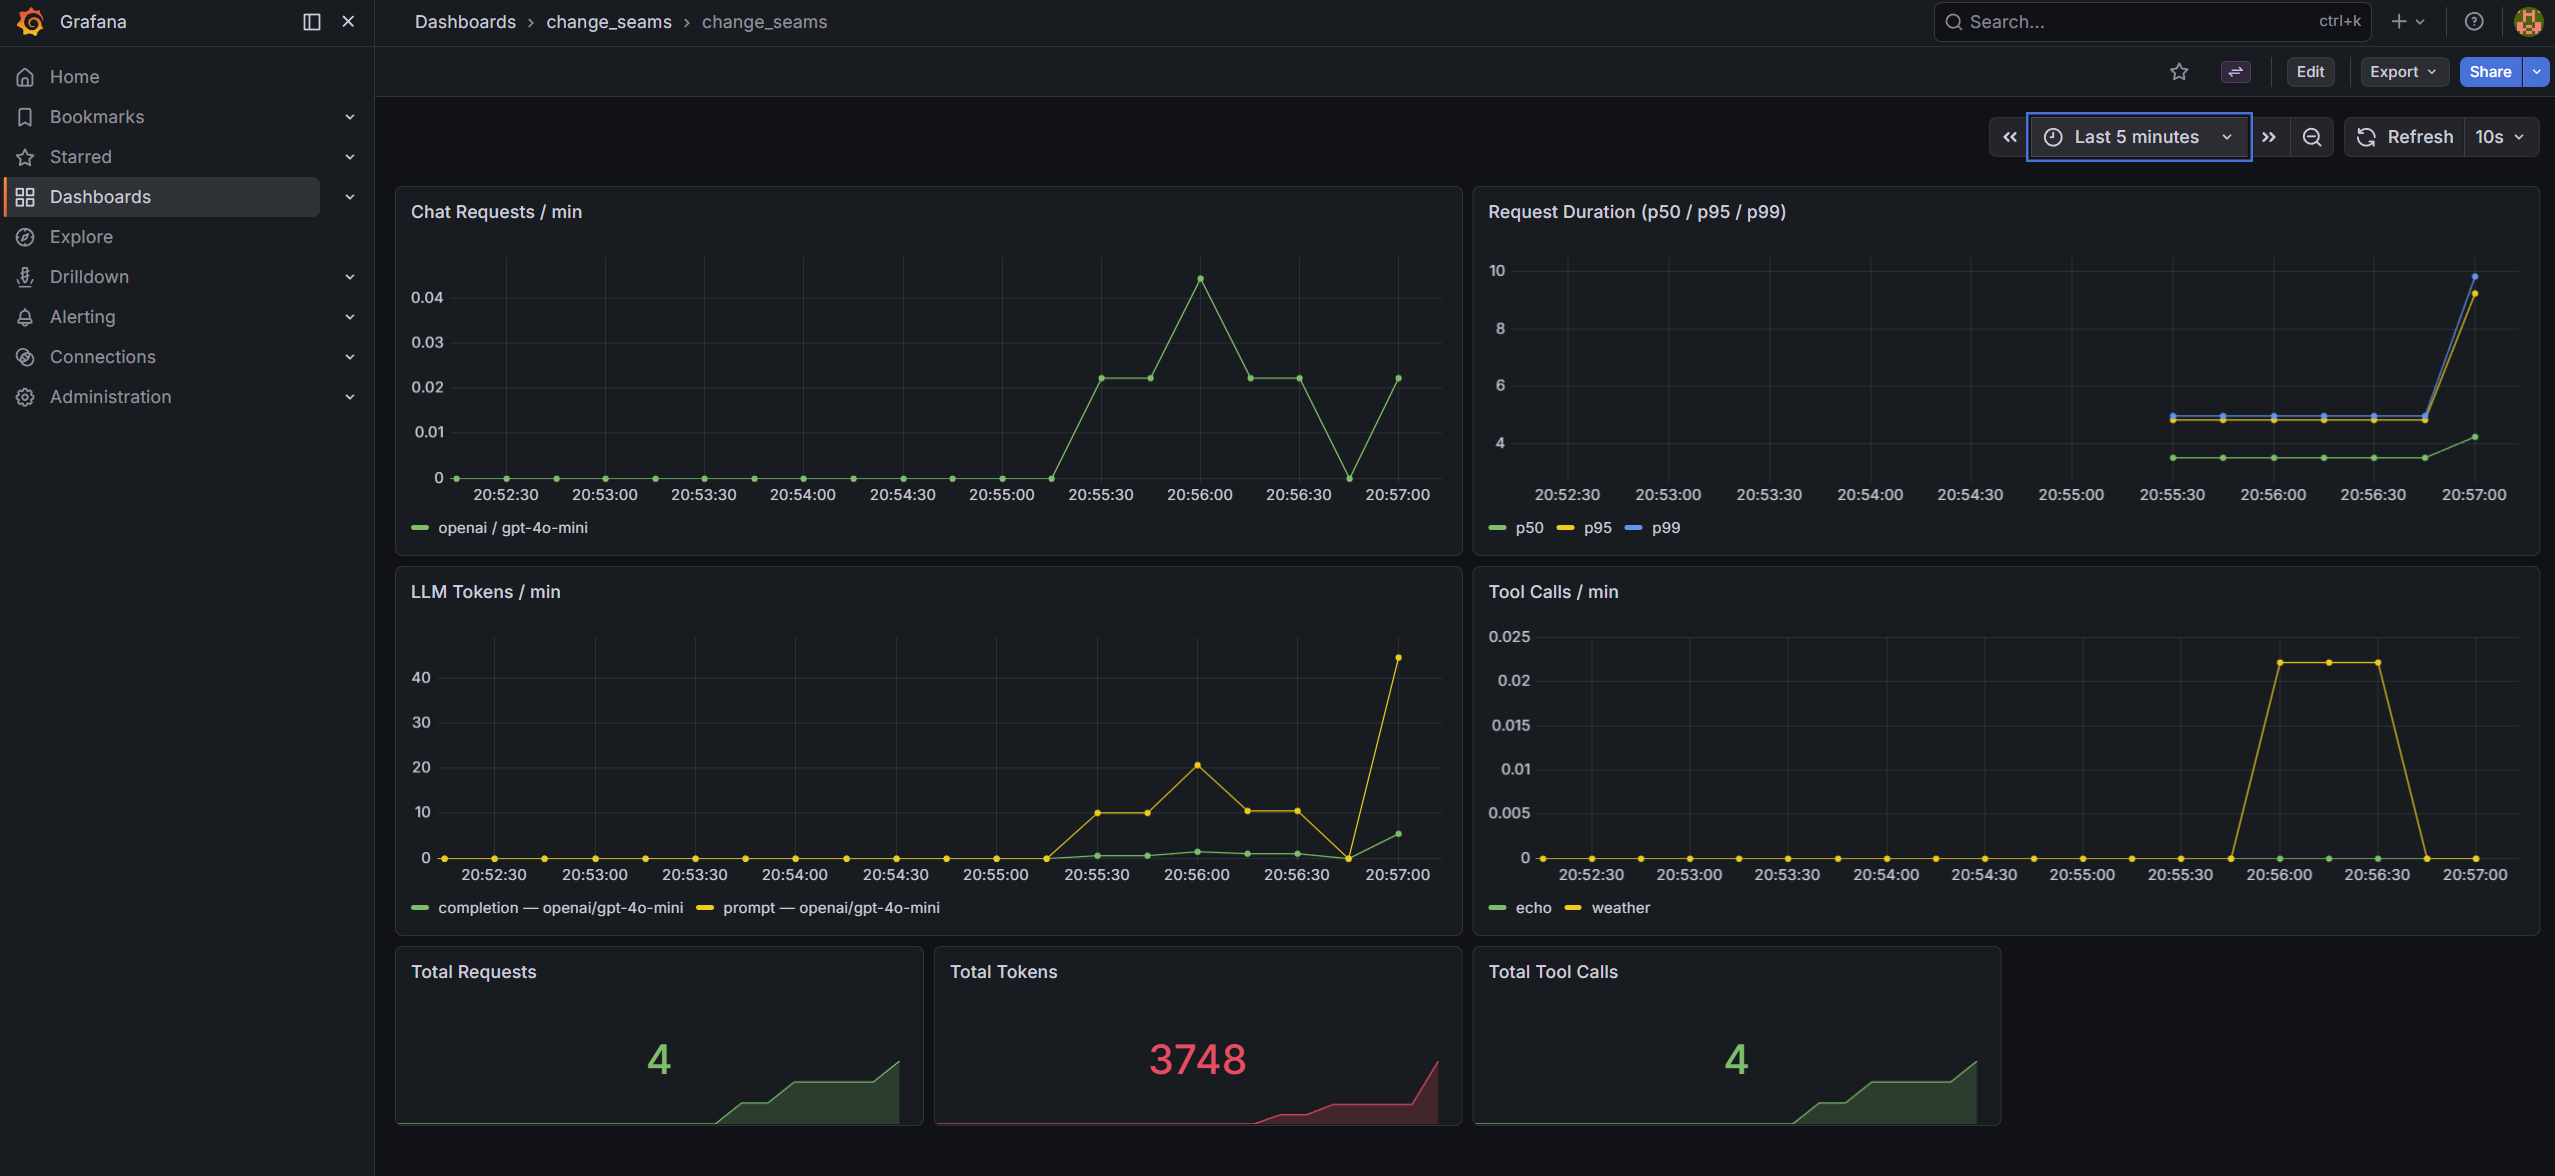
The pre-built dashboard at infra/grafana/dashboards/change_seams.json has seven panels covering the four metrics:
- Chat Requests / min -
rate(chat_requests_total[1m])broken down by provider and model - Request Duration (p50 / p95 / p99) - histogram quantiles from
chat_request_duration_seconds_bucket - LLM Tokens / min -
rate(llm_tokens_total[1m])broken down by token type, provider, and model - Tool Calls / min -
rate(tool_calls_total[1m])by tool name - Three stat panels for running totals: total requests, total tokens, total tool calls
After docker-compose up, Grafana is at http://localhost:3000 (admin / admin). The dashboard is provisioned and ready - no import step.
Skill-Hardening Drills
Drill 1 - Trace a slow request to its cause
Run a request that uses multiple tools, then inspect the spans:
curl -s -X POST http://localhost:8000/api/chat \
  -H "Content-Type: application/json" \
  -d '{"message": "What is the weather in Dublin and how many days until Christmas?"}' \
  | python -m json.tool | grep -A 5 '"spans"'
Each span has a latency_ms field. Find the tool spans and identify which tool took longest. Then open the trace panel in the frontend UI - the same data renders as a waterfall showing which phase dominated the request time.
Goal: Given a response that took over 5 seconds, identify whether the bottleneck was the LLM call or a tool invocation, and name the specific span - without reading logs or source code. If you can't, the spans are missing latency data.
Drill 2 - Watch the Grafana dashboard respond to load
Start docker-compose, send a burst of requests, and watch the metrics update live:
for i in $(seq 1 10); do
  curl -s -X POST http://localhost:8000/api/chat \
    -H "Content-Type: application/json" \
    -d "{\"message\": \"What is $i plus $i?\"}" > /dev/null
  sleep 1
done
Open http://localhost:3000 while the requests are running. Watch "Chat Requests / min" climb and "LLM Tokens / min" accumulate.
Then switch the model in .env:
LLM_MODEL=gpt-4o-mini
Restart the backend, send another burst. The token panel will now show two distinct series - one labelled gpt-4o, one gpt-4o-mini - because the model label is on each metric.
Goal: See two separate model series appear on the dashboard after the provider swap. If the labels are missing or the series are merged, the metric label definitions have a problem.
The Checklist
- [ ] Does every chat response include a
spansarray with per-LLM-call and per-tool latencies? - [ ] Does
GET /metricsexposechat_requests_total,chat_request_duration_seconds,llm_tokens_total, andtool_calls_total? - [ ] Do the metrics carry
providerandmodellabels so you can break down costs by model after a swap? - [ ] Is the tracing exporter swappable by editing only
setup_tracing()- no other changes? - [ ] Does
ObservationLogpersisttool_callsand token counts so you can query historical data from the DB? - [ ] Does a tool error trigger
on_tool_errorand appear in the spans - rather than silently disappearing?
If all six pass, the observability seam is working. If any fail, some of the interior is still dark.
Where to Go From Here
Clone the repo, run docker-compose up, and open Grafana at http://localhost:3000. Send a few requests and watch the panels fill in. Then try replacing ConsoleSpanExporter with OTLPSpanExporter to confirm that the handler is entirely unaware of the change.
The test suite in tests/test_observability.py covers the callback handler, token accumulation, and the /metrics endpoint - run with make test (no API keys needed).
Tracing tells you what happened. Metrics tell you how it's going. Neither is optional once you're in production.